
Shopify store SEO: three times more traffic in three months
An online store for professional tools and electrical supplies with thousands of products on Shopify. We built a new storefront for the Shopify store and did technical SEO, a new category tree, content for the whole catalog, and one-step checkout - in 13 weeks.
- Client
- Rittbul
- Project
- Shopify store
- Built with
- Shopify, Next.js, Vercel, Google Analytics
Traffic comes from Google Search Console (Aug 2-15, 2026 vs. Oct 18-31, 2026), sales come straight from Shopify, without test and cancelled orders. The absolute figures stay between us and the client.
The results
The numbers first, then how we got there.
Organic search
Over 94% of clicks come from queries without the brand name - people searching for “knipex pliers”, “wago connectors”, “voltage tester”, or a part number. The site's average position went from 14.3 to 7.3, and on phones from 12.8 to 6.8. Year over year, October 2026 vs. October 2025: +65% clicks and +96% impressions.
| Google Search Console | Change |
|---|---|
| Clicks per day | +237% |
| Impressions per day | +245% |
| Clicks from non-brand queries | +229% |
| Queries in the top 10 | ×2.8 |
| Queries the site shows up for | ×2.1 |
| Pages that get impressions | +75% |
| Clicks to product pages | ×4 |
| Clicks to categories | ×3.1 |
| Clicks from phones | +273% |
Sales
The most conservative comparison is with July 2026, the last full month before we started. Even there, revenue nearly doubles.
| Shopify | Orders | Revenue | New customers |
|---|---|---|---|
| October 2026 vs. October 2025 | +332% | +181% | +424% |
| September-October 2026 vs. 2025 | +205% | +126% | +252% |
| October 2026 vs. July 2026 (before us) | +74% | +87% | +82% |
| October 2026 vs. August 2026 | +58% | +97% | +54% |
Google became the No. 1 source
In July, most orders came from paid ads on Facebook and Instagram. In October, organic Google's share of purchases went from about a third to about half. Visits from social ads went down while orders kept growing.
ChatGPT brings the best traffic
Traffic from ChatGPT is 9 times higher than in July and converts about 4 times better than organic Google. People land straight on a product page, already knowing what to buy.
Google Images
Across 12 tracked queries: 3 of our images in the top 100 on Sep 30 and 22 on Nov 2. Image clicks are up 50% year over year. Across 20 queries, the store has the most images in the top 100, ahead of the biggest stores in Bulgaria.
Speed and stability
The page no longer jumps while it loads, and it responds to a tap right away. Lighthouse, home page.
| Lighthouse | June 2026, old theme | November 2026, new storefront |
|---|---|---|
| Performance, desktop | 57 | 97 |
| LCP, desktop | 3.0 s | 1.3 s |
| CLS, desktop (layout shift on load) | 0.622 | 0 |
| TBT, phone (page blocking) | 350 ms | 10 ms |
The starting point
The store had a strong base: good brands, a wide range, and loyal customers. The problems were in how the site showed all that to Google and to buyers.
A heavy theme
The Shopify theme loaded over 20 JavaScript files on the home page, and on desktop the content shifted while loading (CLS 0.622, where the norm is under 0.1).
Filters in the index
Combinations like “category + brand” and “category + price” went into Google as separate pages and split the strength of the real categories.
A catalog without structure
319 products couldn't be reached from any menu, and there were duplicate products and categories competing for the same query.
Thin descriptions
Thousands of products had 15-20 words of their own text, usually a template intro and a table.
Data you can't trust
Analytics didn't see every order, and orders didn't record where the buyer came from. Without that, you can't tell what works.
A long checkout
Ordering took several screens, including for cash on delivery, the most common payment method.
How we did it
Ten workstreams, rolled out in an order that protects the pages that already earn.
Measure first, change second
In the first week we didn't touch the site. We connected Search Console, GA4, and Shopify through their APIs and checked order by order what analytics saw against what was actually sold.
- A recorded baseline - every number in this case study is measured against it
- Purchases from the new storefront are tracked in GA4
- The source of every order (ads, Google, email) is kept for up to 30 days and saved on the order itself in Shopify
A new storefront: a headless Shopify store on Next.js
Shopify stayed in charge of the catalog, payments, and orders. The storefront buyers see is completely new, built on Next.js on Vercel and connected to Shopify through the Storefront API.
- A full dress rehearsal on all 5,206 URLs of the old site before the switch - every one responded correctly
- The switch itself on August 29, 2026 took about 4 minutes
- Every old URL leads to the same page or, with a 301, to the closest one
- 18 days after the switch, clicks were unchanged and the top pages were indexed with the correct canonical
- We left the earning pages alone for 4 more weeks while Google re-evaluated them
- Pages update within seconds of a change in Shopify - only the affected product, not the whole catalog
Technical SEO
The site's strength had to flow to real categories and products, not to utility URLs.
- Filter combinations out of the index, old faceted URLs redirect to the category
- A clean sitemap with products, categories, and images
- Schema.org for products, categories, breadcrumbs, and FAQs
- Duplicate products merged - the stronger one stays, the other redirects
- 86 queries where two of our categories competed were reviewed and fixed where there was a real problem
A new category tree
The catalog of thousands of products was reorganized so that both buyers and Google find everything in two clicks.
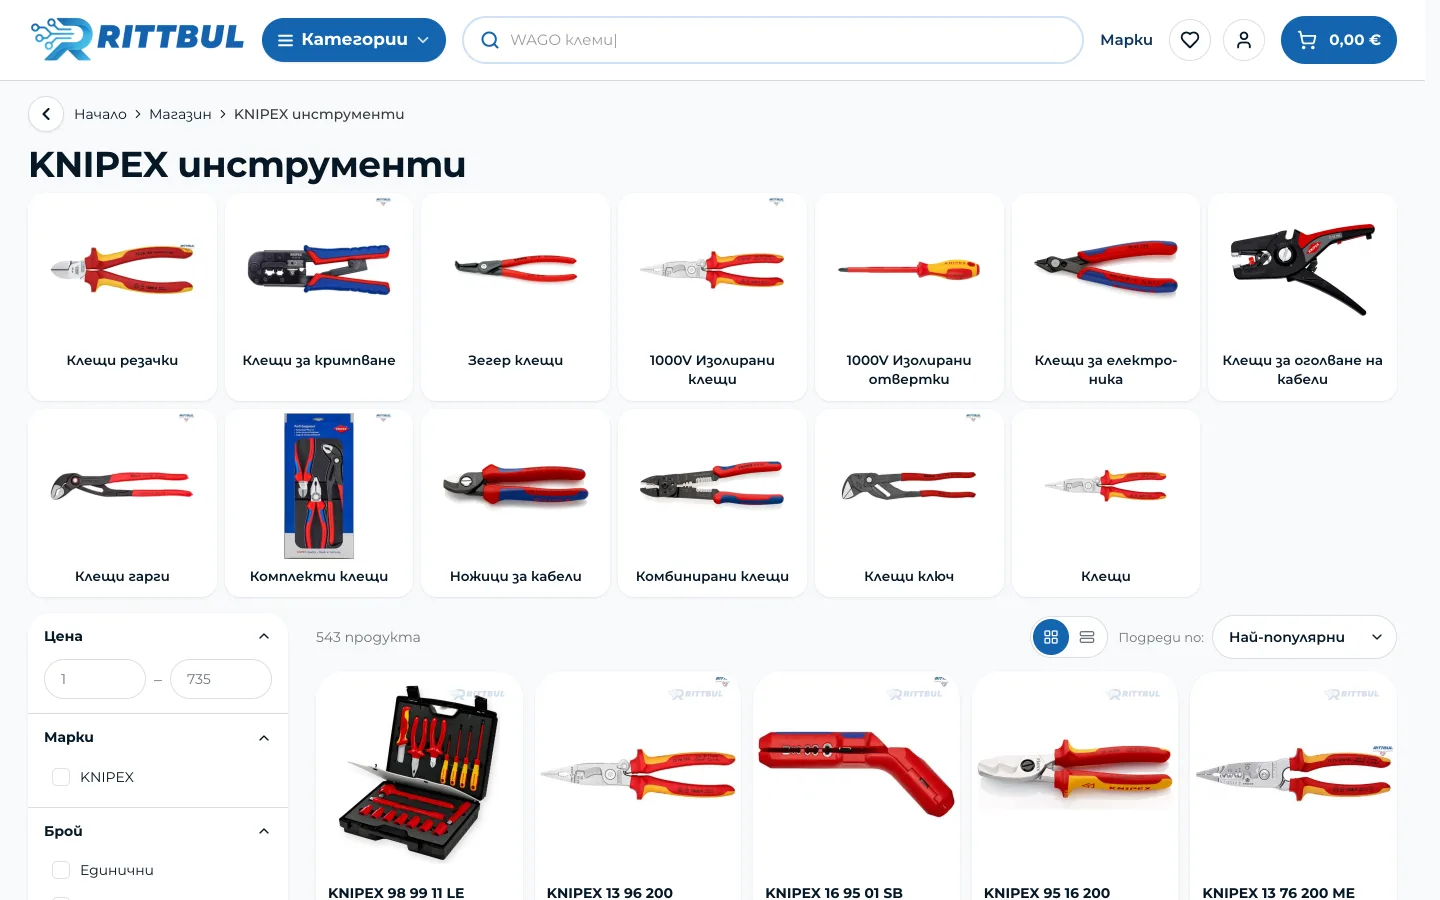
- 10 main groups and a two-level mega menu with images
- Products with no path through the menu: from 319 to 0
- Automatic rules - a new product lands in the right category by brand, series, or type on its own
- Over 220 missing attributes filled in so the filters work (e.g. “Breaking capacity” on RCDs now covers 98% of products instead of 23%)
Content written for the buyer
The copy follows how people actually search - “knipex pliers”, not just the part number.
- Over 200 categories with new copy, released in waves with checks before and after each write
- Over 2,000 product descriptions rewritten from manufacturer data
- In the largest group (nearly 900 products), the product's own text went from 15 to 58 words
- Over 1,000 products now show datasheets and manuals as PDFs
A fuller catalog
More products, but only with checked photos, descriptions, and attributes.
- Over 50% more active products in three months, imported brand by brand
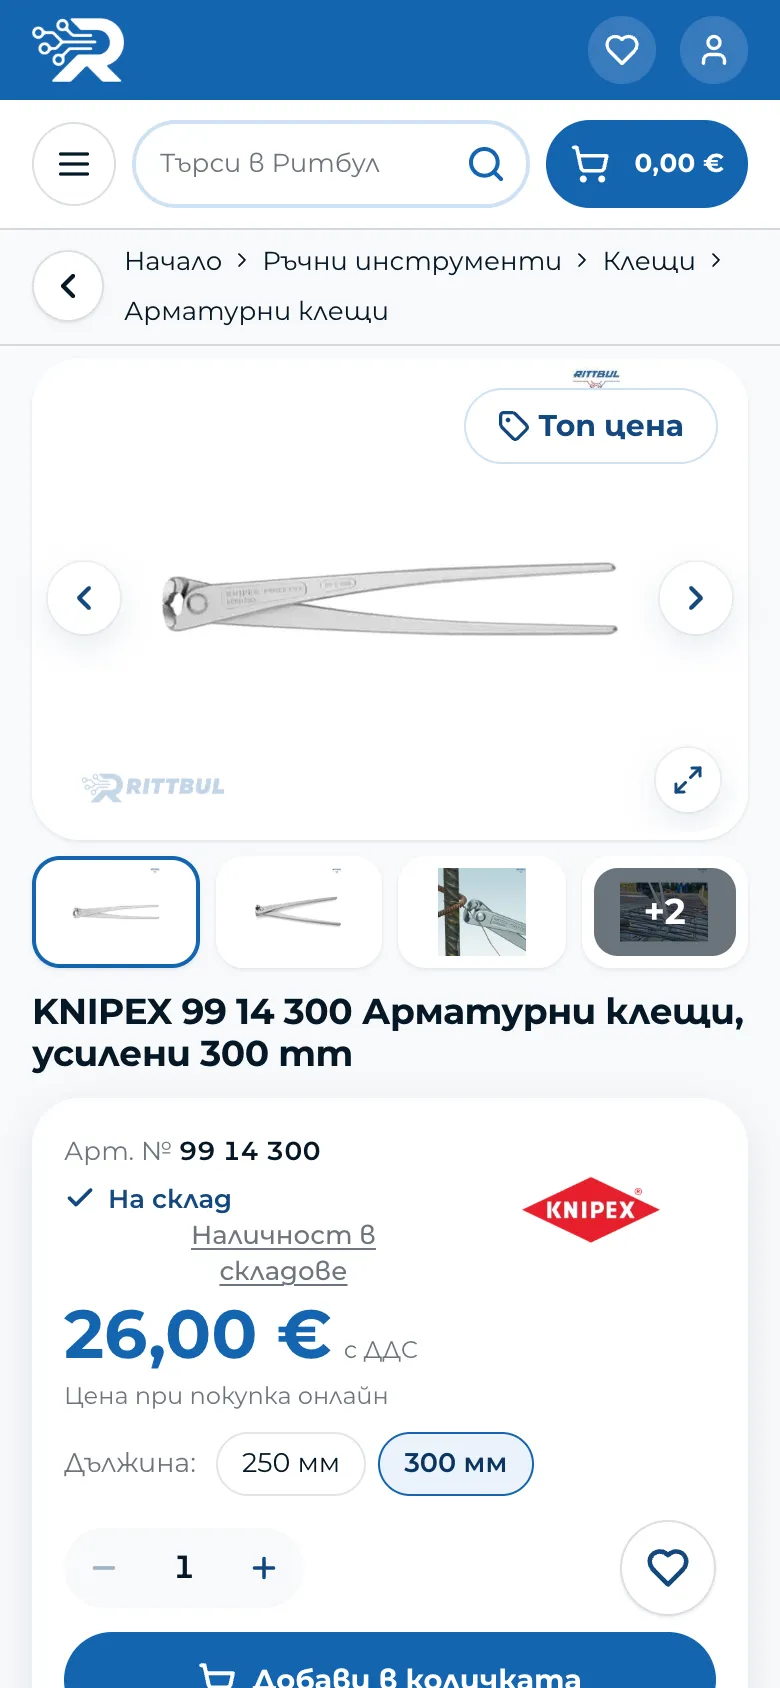
- A variant switcher (size, length, cross-section) for products in the same family
- Sold by the piece and by the box for connectors and consumables
- “Bought together” - accessories are linked by the manufacturer's series
Google Images
For professional tools, the image often decides which store gets the click.
- A pilot with a control group: 300 products split into two equal groups, descriptive alt text only on the first
- Every photo reviewed by eye, with alt text describing the type, brand, and part number
- Product images and over 200 category images in the sitemap
- Image URLs weren't changed during the migration - Google Images remembers an image by its URL
One-step checkout
Many buyers order from a phone and pay cash on delivery, so the checkout is as short as it gets.
- A one-step popup: town, delivery option with its price, details, and “Order with cash on delivery”
- Speedy and Econt to an office or an address, with prices checked against real shipments to the cent
- Invoices for companies: the company ID is validated, and the EU VIES register fills in the VAT number, company name, and address
- “Add to the same parcel” - after ordering, the buyer can add another product to the same shipment
- An email with matching accessories 7 days after the purchase
- “Build your panel” - a configurator that assembles a complete electrical panel with price and stock and puts it in the cart
A real-time link to the warehouse
Our own connection between the warehouse (ERP) system and Shopify instead of an off-the-shelf integration.
- Prices and stock sync every minute, plus a full reconciliation every hour
- The very first run cleared dozens of old mismatches between the warehouse and the site
- Orders go to the warehouse automatically, with the invoice details checked first
- Stock by warehouse on the product page - buyers see which city the item is in
The mobile experience
Two thirds of visits come from phones, so every screen was designed for a small display first.
- One row: menu, search, and cart, with “Order by 14:00 - ships today” at the top
- Adding to the cart doesn't interrupt browsing
- An “Add to your phone” button - the store installs as an app on the home screen
Store screenshots
Swipe sideways. Click an image to enlarge it.
On a phone
What we learned
Measure before you change
Without checking analytics against real orders, we would have optimized on the wrong numbers.
Rehearse the migration
A full rehearsal of every URL before the switch and a check 18 days later. Zero traffic lost.
Be patient with earning pages
After a migration, Google re-evaluates the site for a few weeks. We waited before touching the pages that make money.
Pilot first, then scale
Alt text, descriptions, and categories started on a small group, measured against a control.
The catalog is the SEO
The growth came from product pages (×4 clicks) and categories (×3.1), not from blog posts.
Frequently asked questions
What is headless Shopify?
Shopify stays in charge of the catalog, payments, and orders, while the storefront buyers see is a separate site (in our case Next.js) connected to Shopify through an API. The site is faster and has full freedom for SEO and checkout, without losing what Shopify does well.
Do you lose traffic when you change the theme or platform?
You can, if URLs change without redirects. For Rittbul we ran a full rehearsal on all 5,206 URLs before the switch and checked again 18 days later. Clicks didn't drop.
How long does it take to see results from e-commerce SEO?
For Rittbul, the first 4 weeks went into measurement, the migration, and the technical foundation. Growth started in mid-September, and by the end of October Google clicks were 3.4 times higher than in early August.
Why only percentages and no absolute sales?
Revenue and order counts are the client's business information. Percentages show the change honestly without giving away someone else's data.
Do you build Shopify stores?
Yes. We build Shopify stores with a ready-made theme or, when speed and SEO matter, with a separate Next.js storefront (headless), as for Rittbul. We also handle migration from another platform, redirecting every old URL.
Can you do the same for our store?
Yes. We work with Shopify and with custom Next.js storefronts, and we do technical SEO, catalog content, and warehouse system integrations. We start with an audit and a measured baseline.
Have a similar project?
Tell us briefly what you need and we'll send concrete guidance by email, no mandatory meeting.
Explore more projects
See how we helped other businesses achieve real results online.


Let's build your next project.
Have a site or just considering one? Tell us briefly and we’ll send concrete guidance by email, no mandatory meeting.
- 0879 406 809
- info@codingturtles.com
- 9 Vasil Levski Str., Pleven, Bulgaria